Systems thinking · Data insights · B2B2C
Visualizing Success
Helping customers make sense of their survey results 4x faster by delivering a responses table.

My role
I led the design from concept to execution


3 Engineers
Engineering Team
The feature started in June and launched in August 2022.
The Problem
Customers could not easily access their data
During data collection, while surveys were still live, customers could not easily review data quality. For photo and video tasks, they wanted to start drawing insights before collection was complete.
Customers were frustrated by...
- • slow exporting to see survey responses.
- • the slow performance and cumbersome UX of viewing submissions.
- • always seeing demographic information since it did not matter to their use cases.
- • not being able to filter by responses to segment their results.
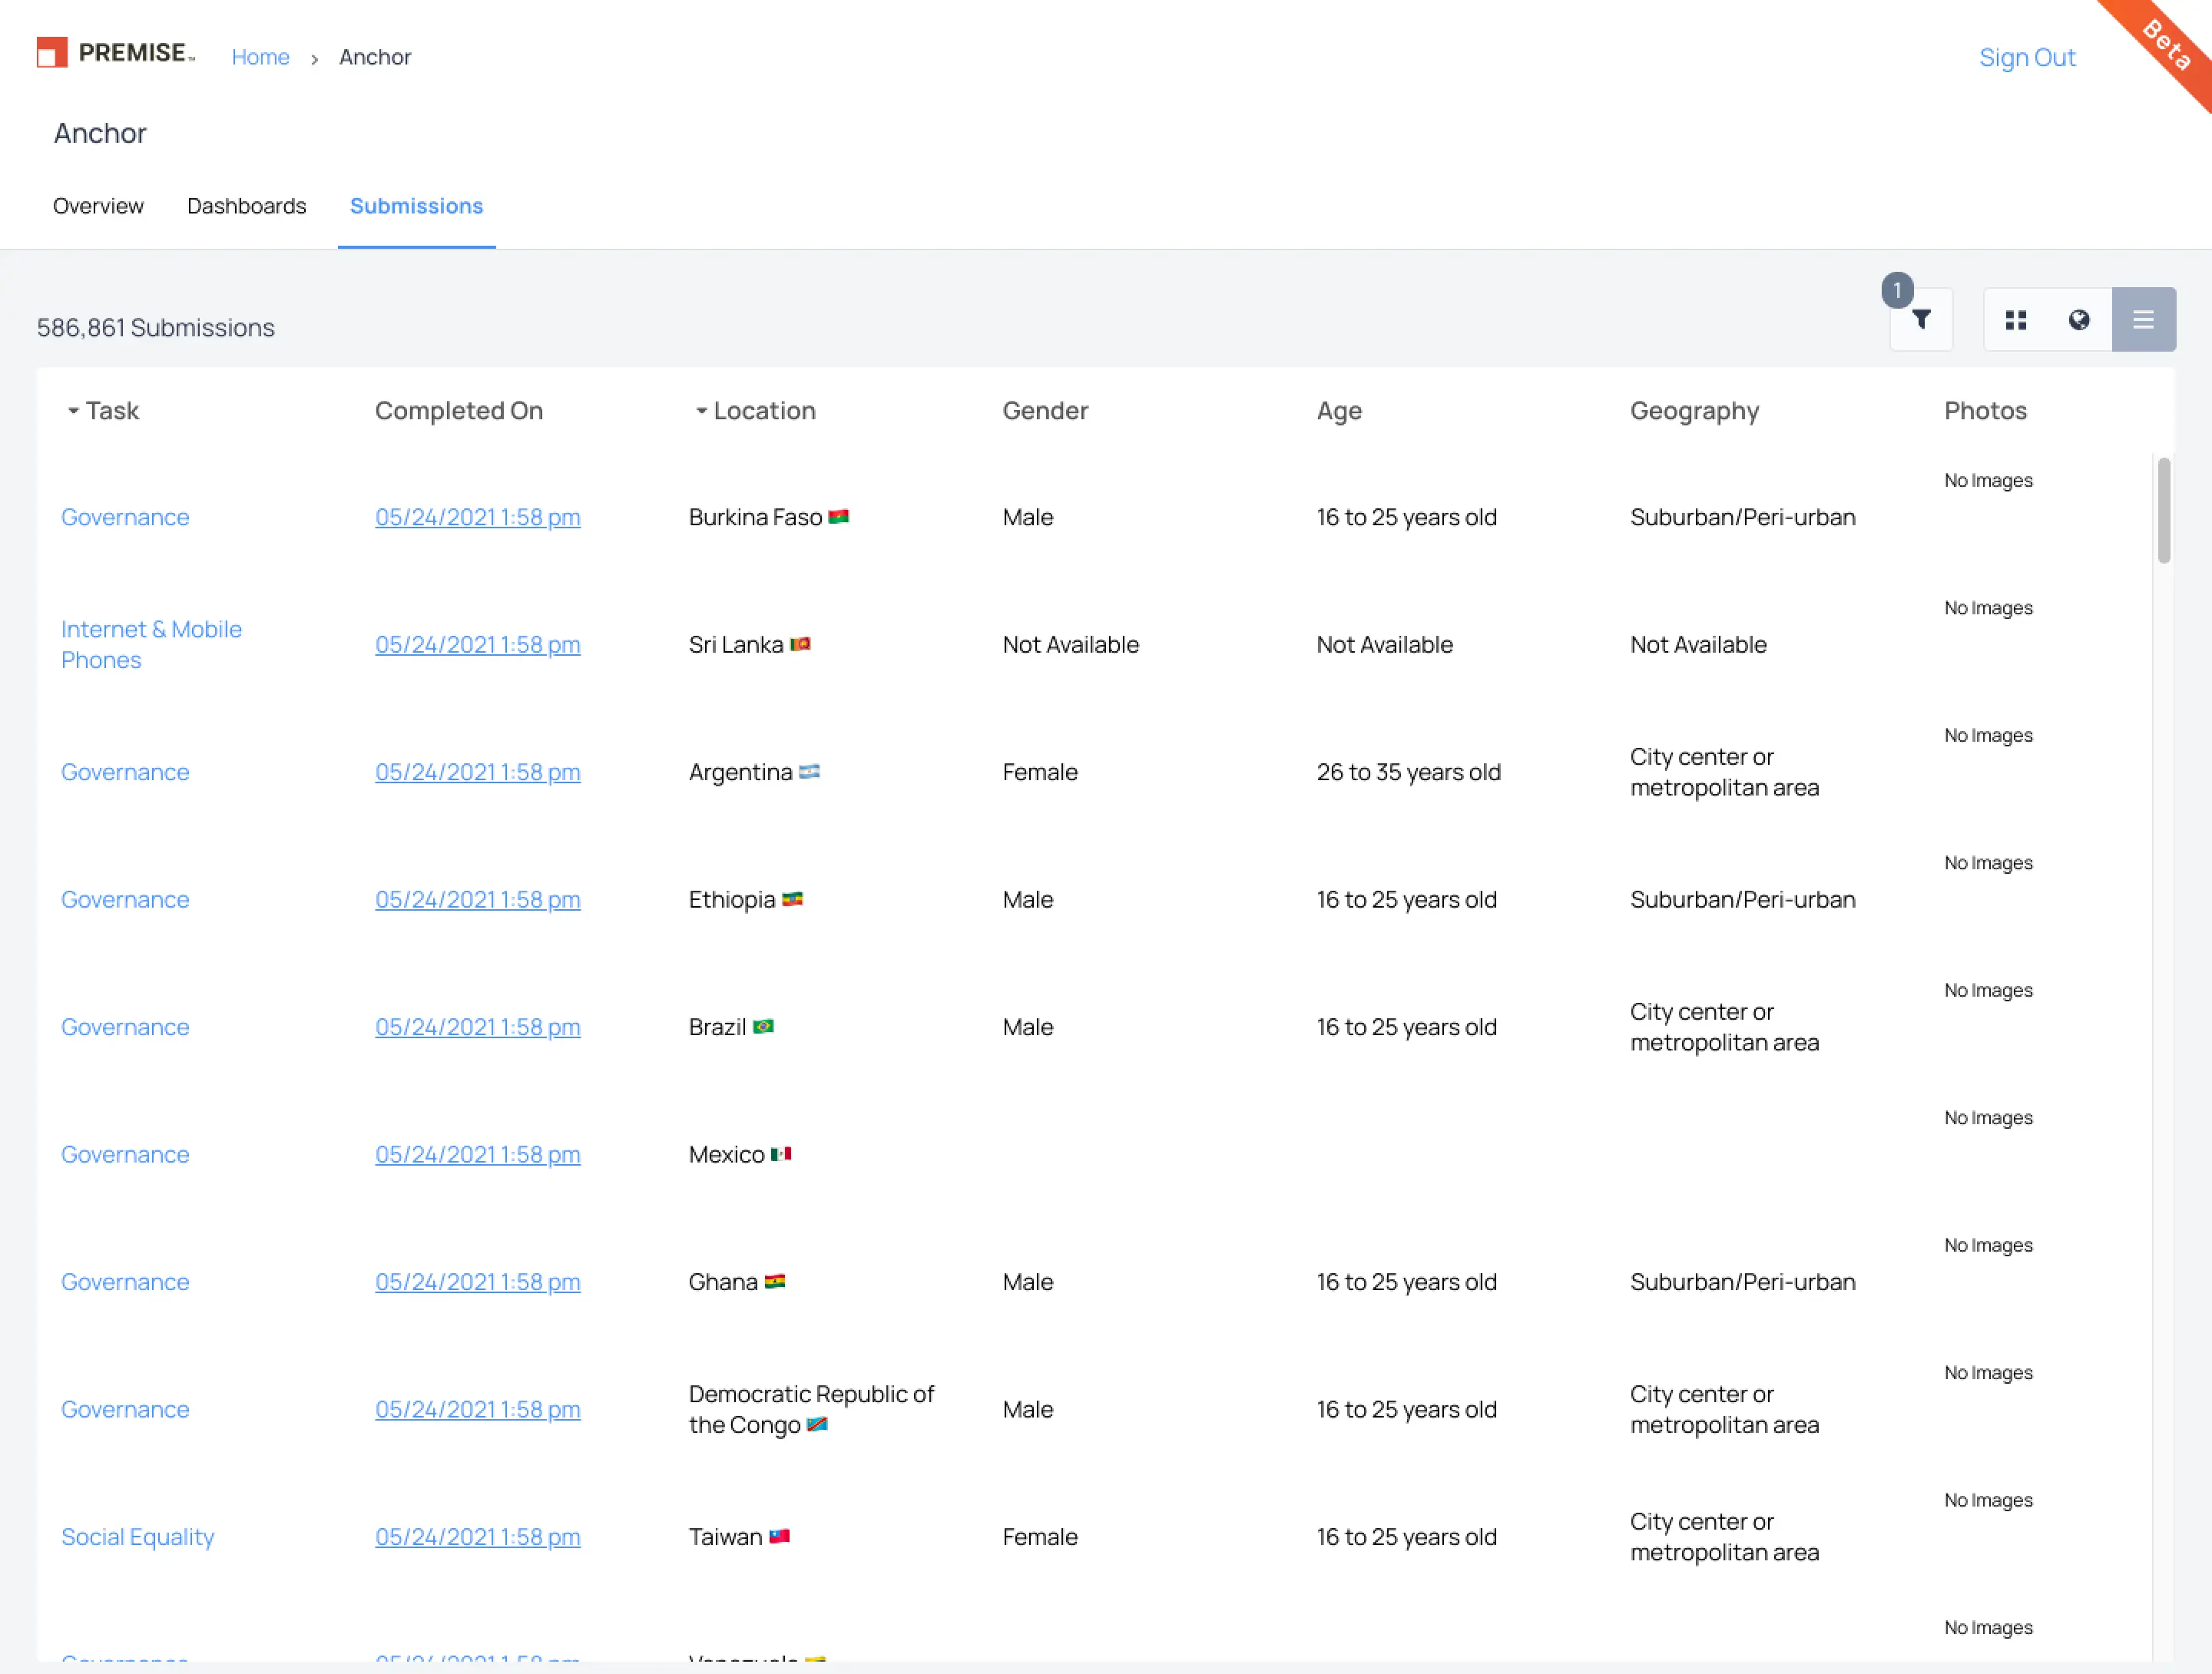
Here's what the submission table looked like before the project—it didn't display individual question responses.

Clicking on a submission displayed the individual responses, but it was confusing when data was missing. It was unclear whether the absence was due to conditional logic or a skipped question.
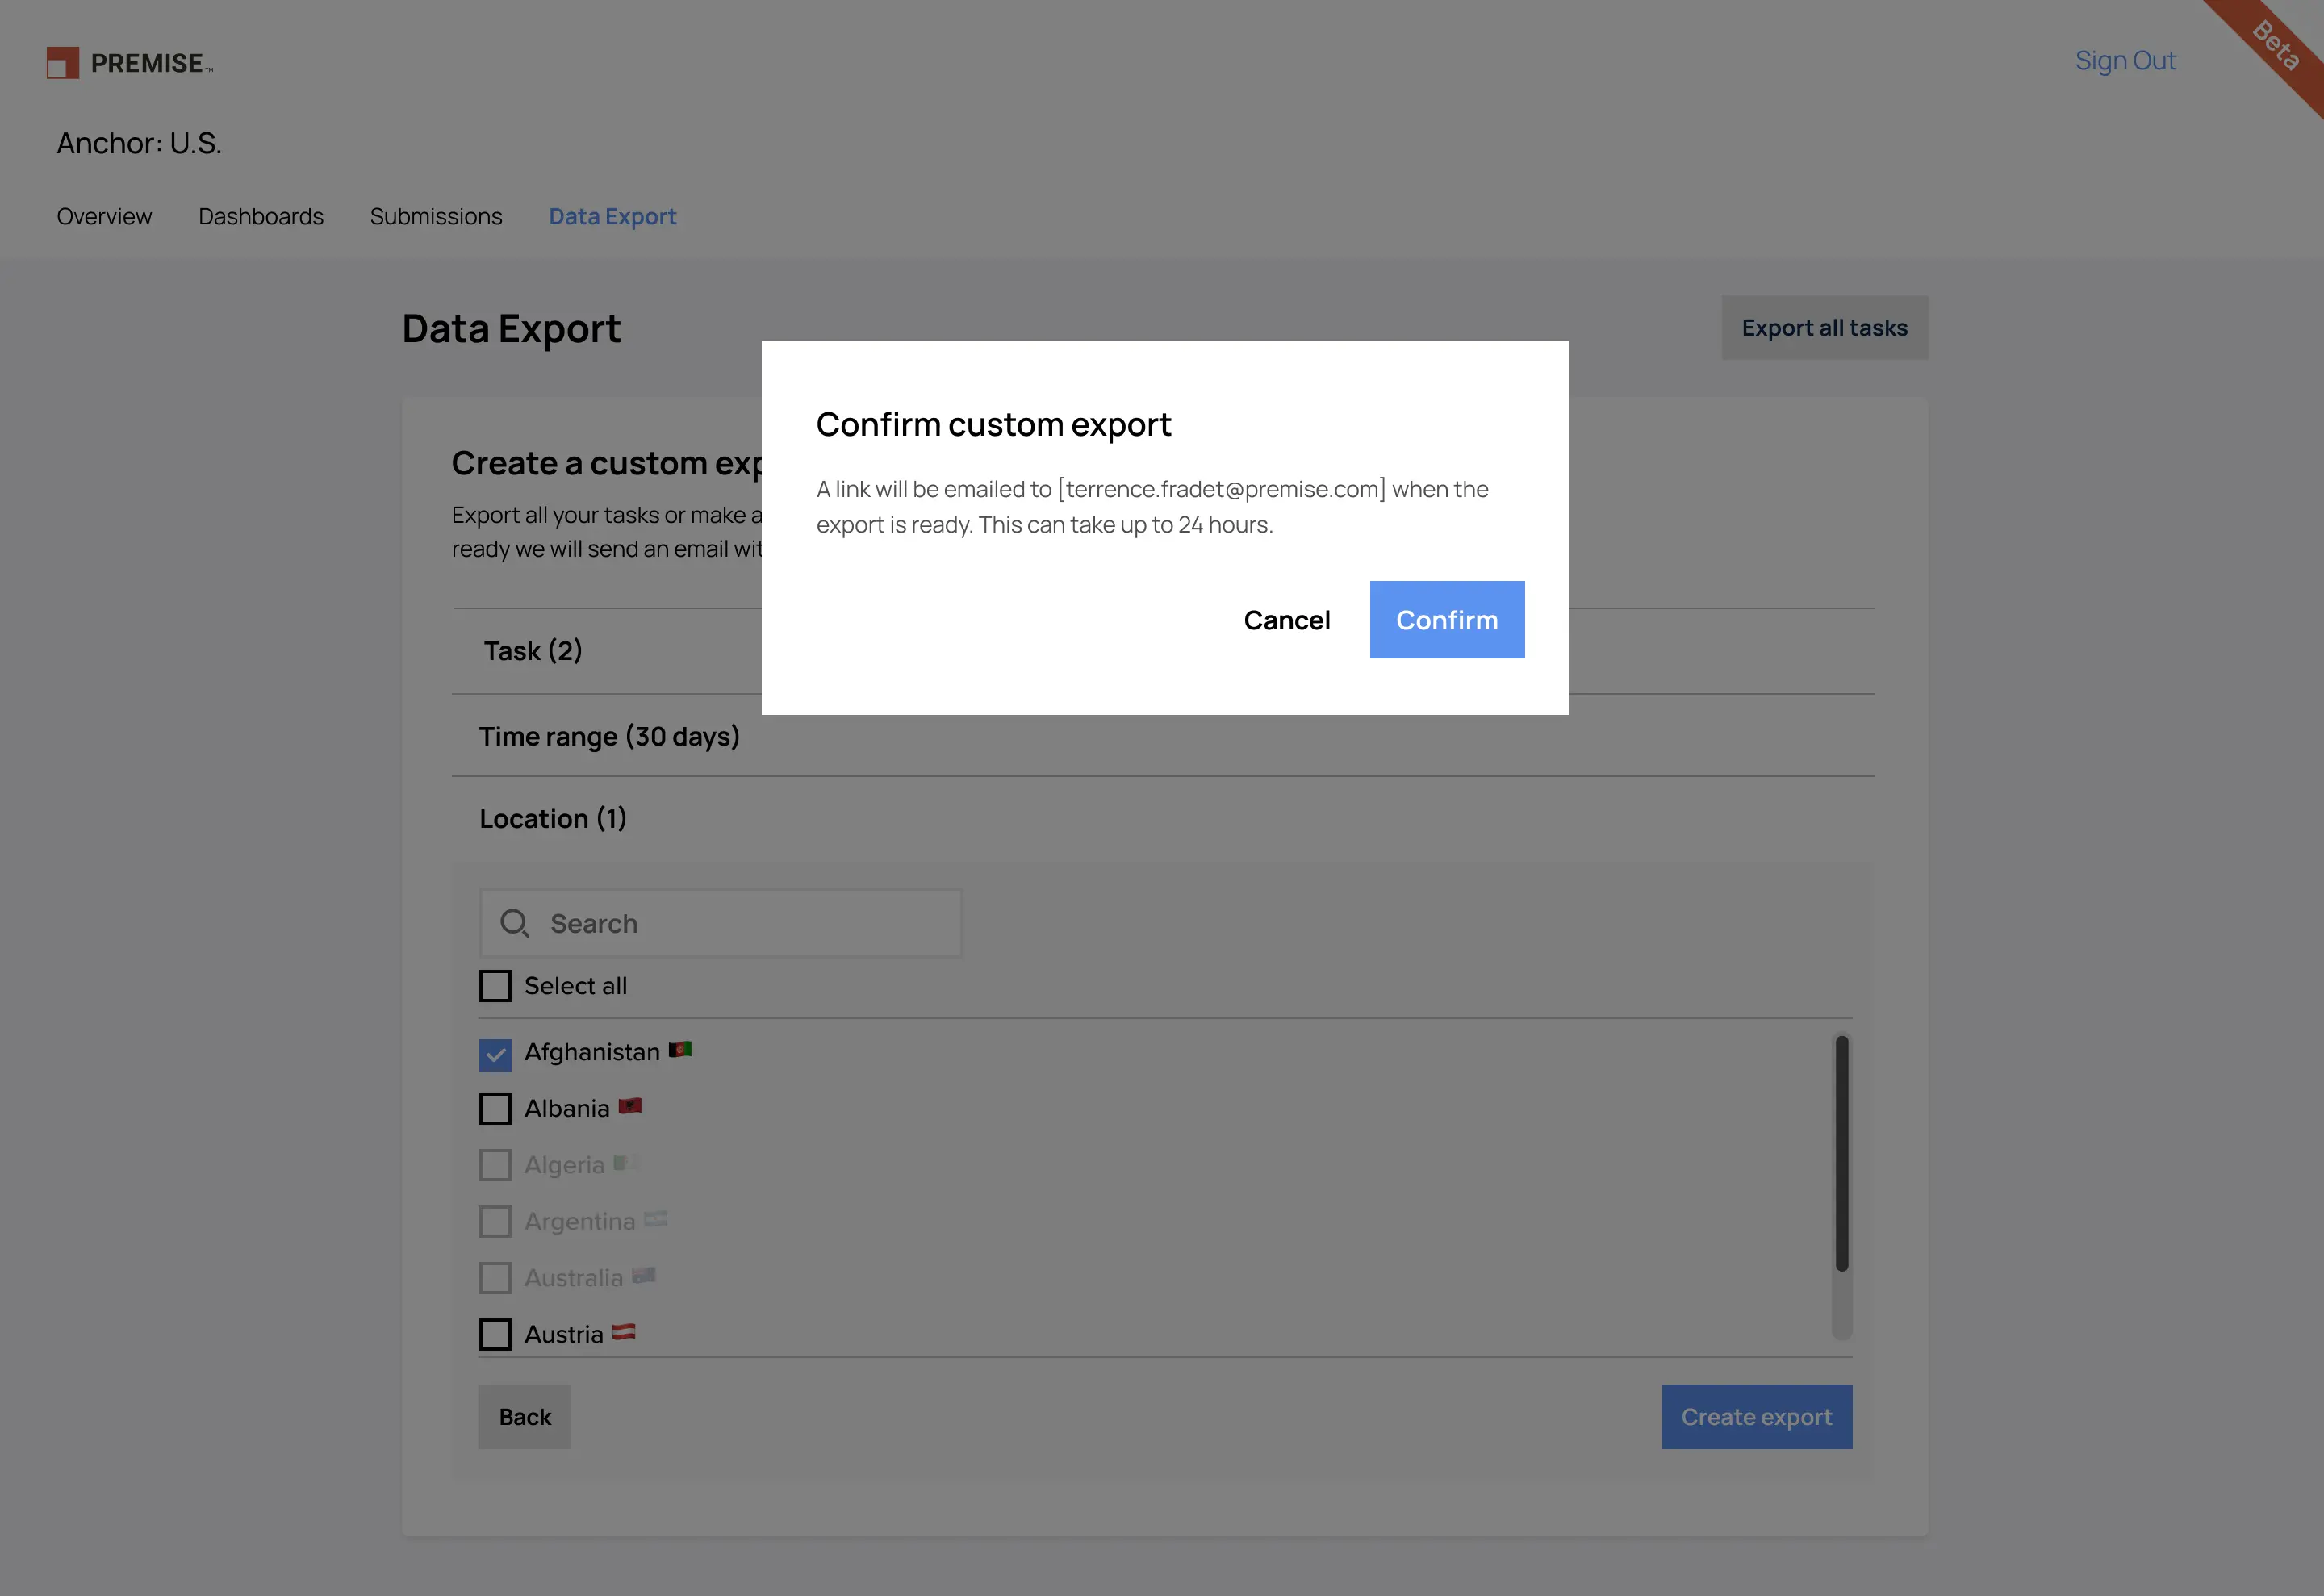
Exporting data required going through a workflow and waiting up to 24 hours to get the data. The data often came in multiple CSV files which confused the customer but was a result of collection data from multiple form versions.
How might we help customers see their results?
The Redesign
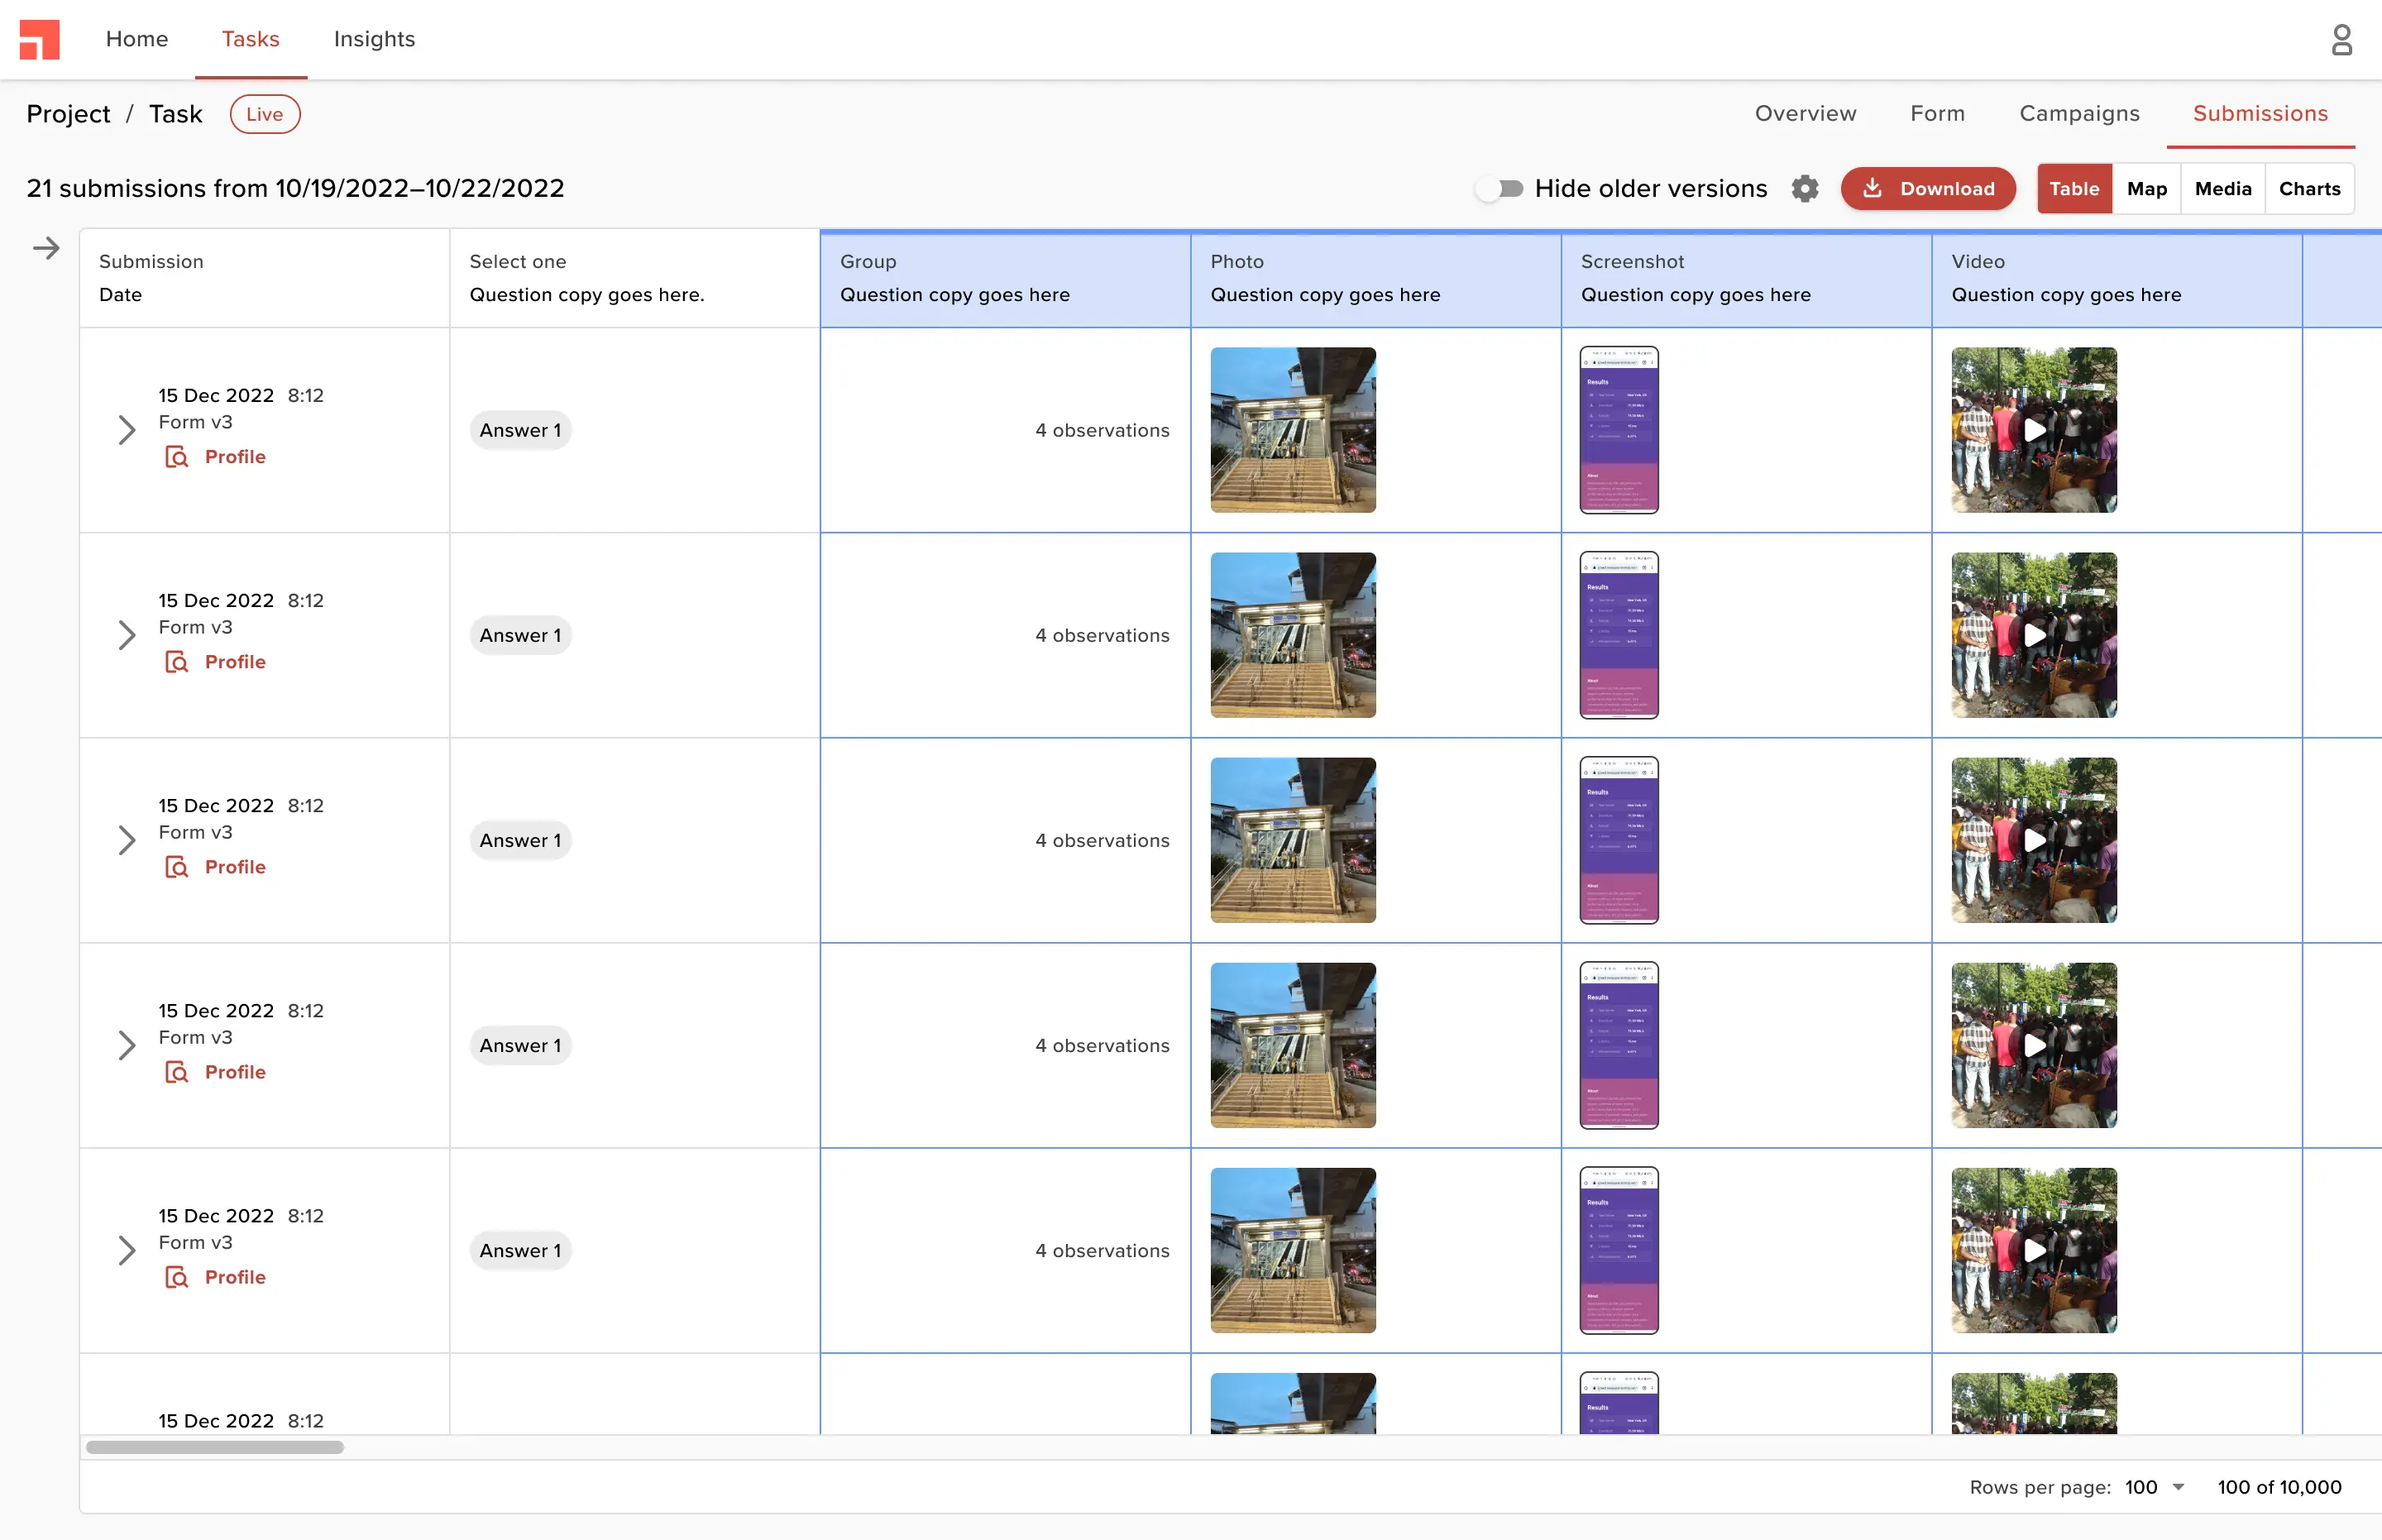
Introducing the Submission Response Viewer
Just show me the data
Customers wanted quick access to submission-level data, and that's exactly what I delivered. Behind the scenes, we tackled complex challenges like handling nested observations and multiple form versions to ensure a seamless experience. Customers could also configure which columns to display.
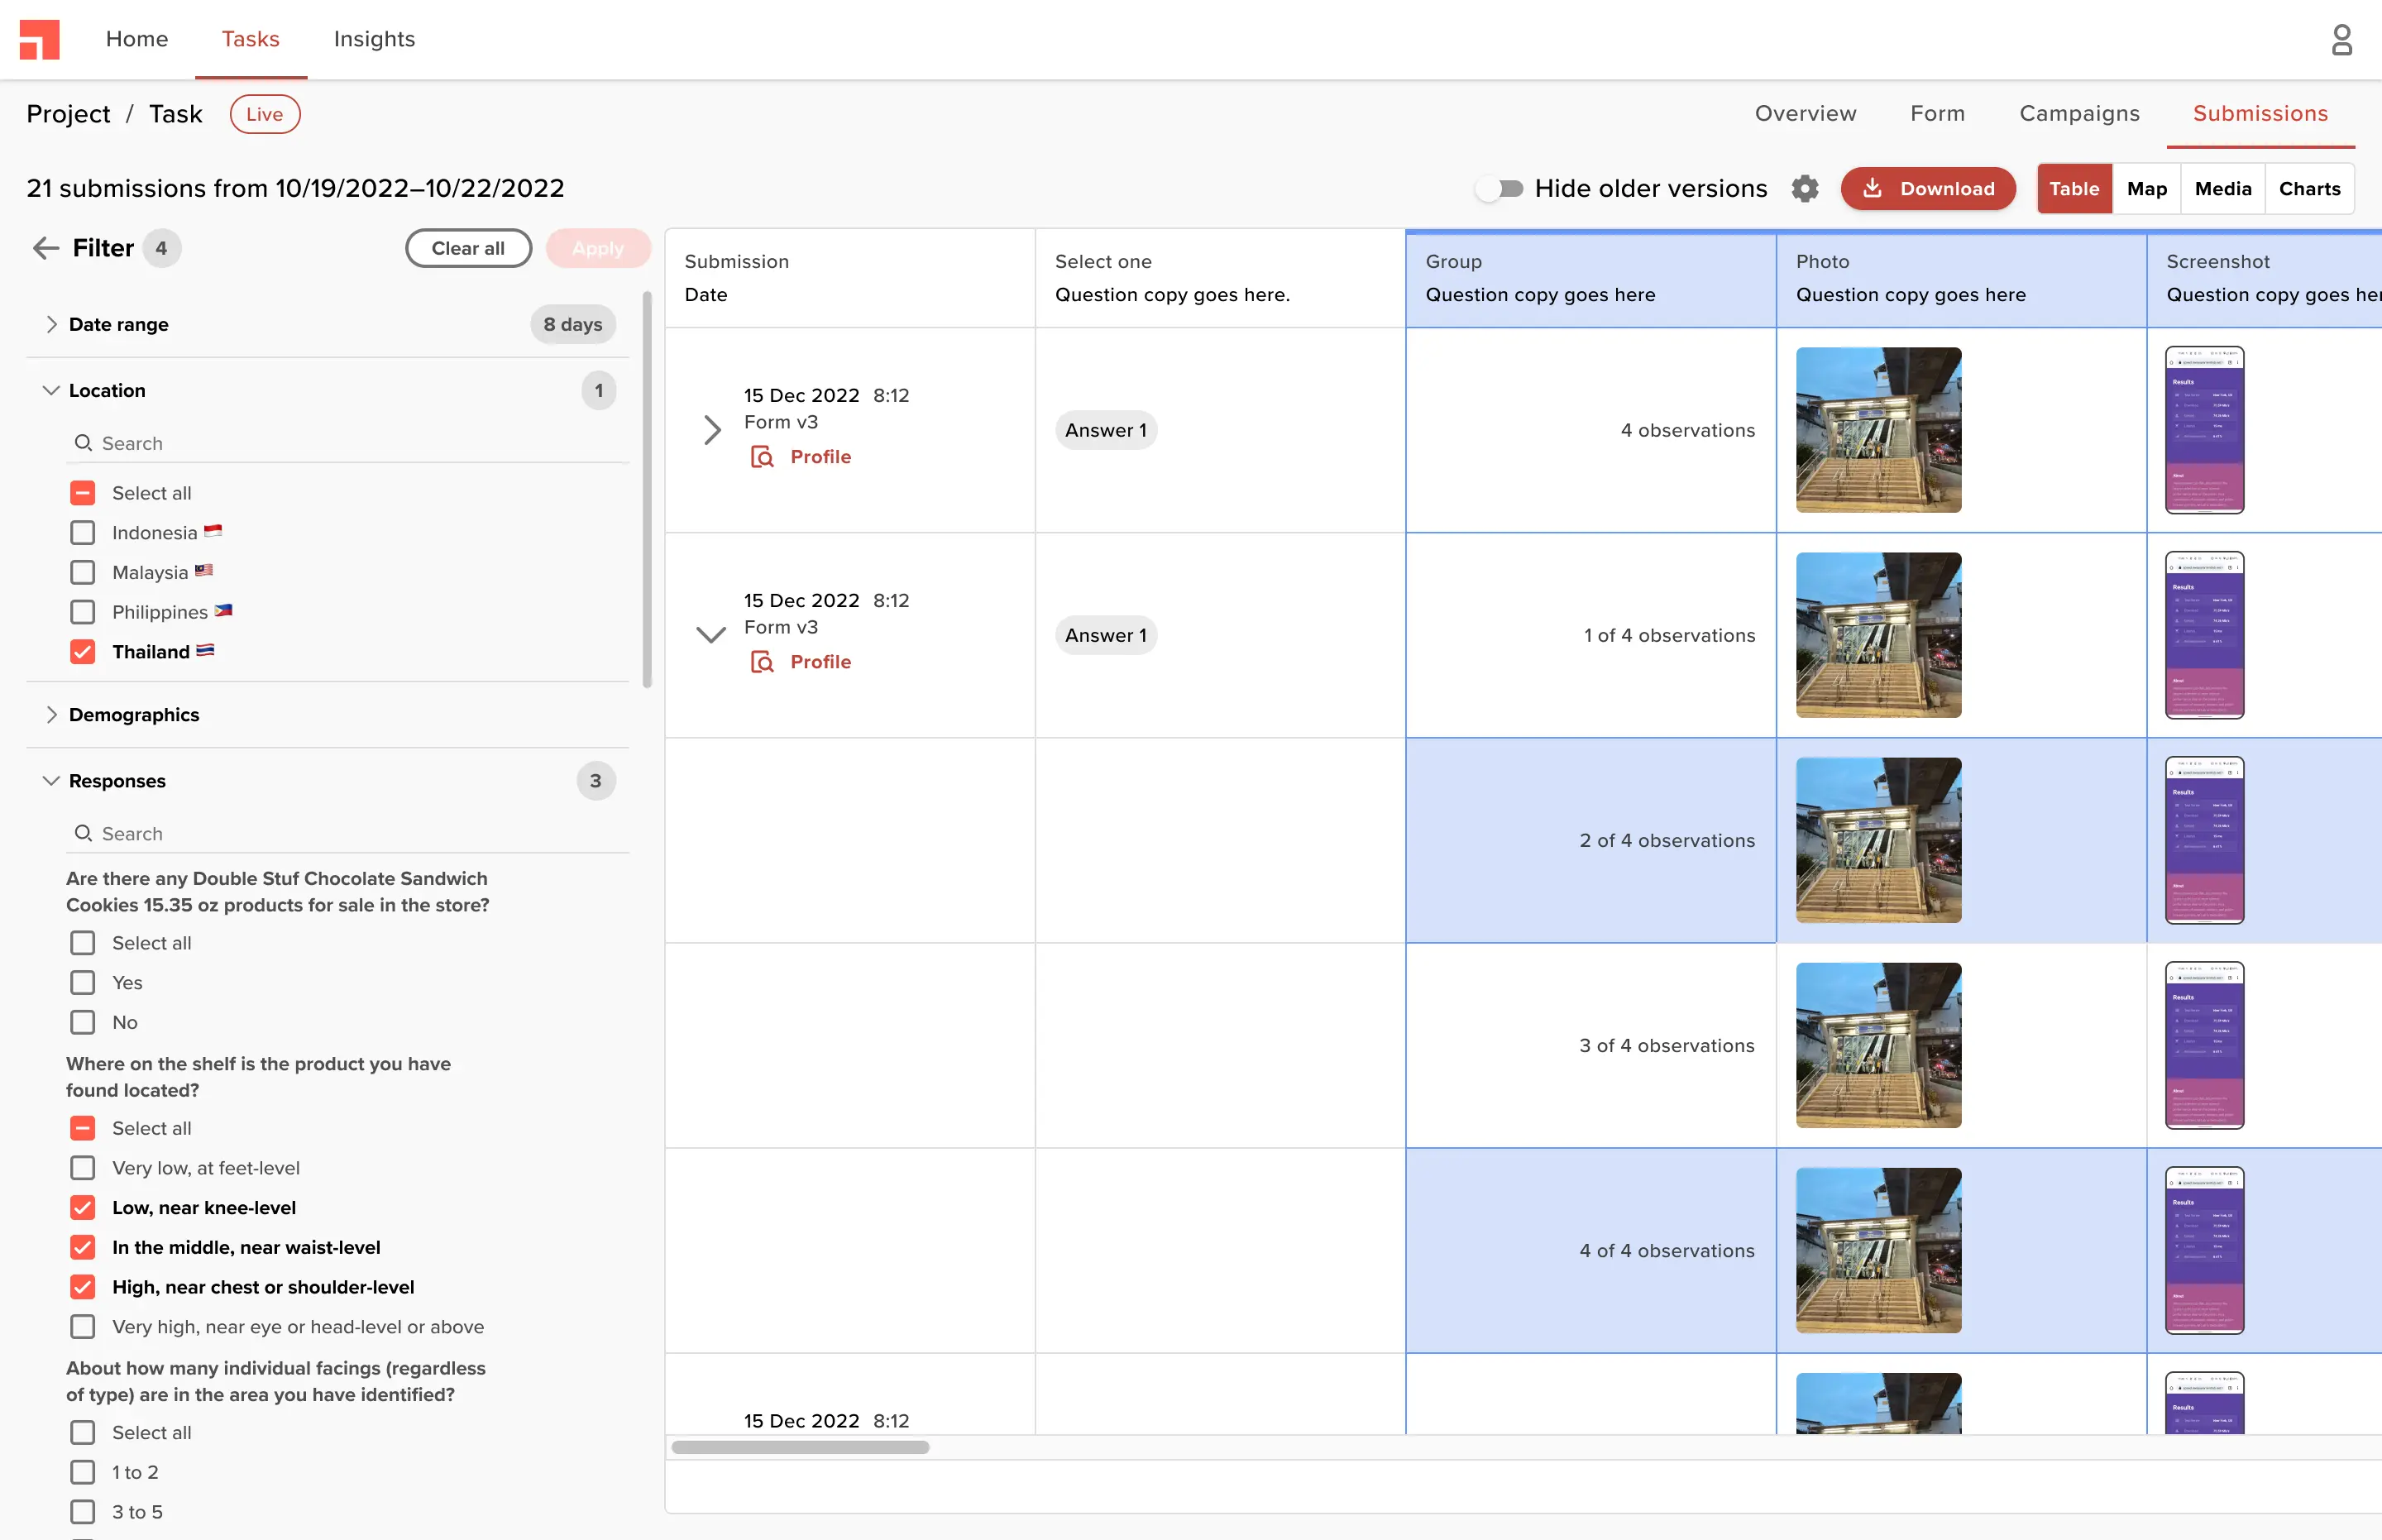
Filter and export
Previously, data was exported through a cumbersome wizard flow. Now, customers can filter and preview thousands of submissions in real-time, giving them clarity on what they are exporting.
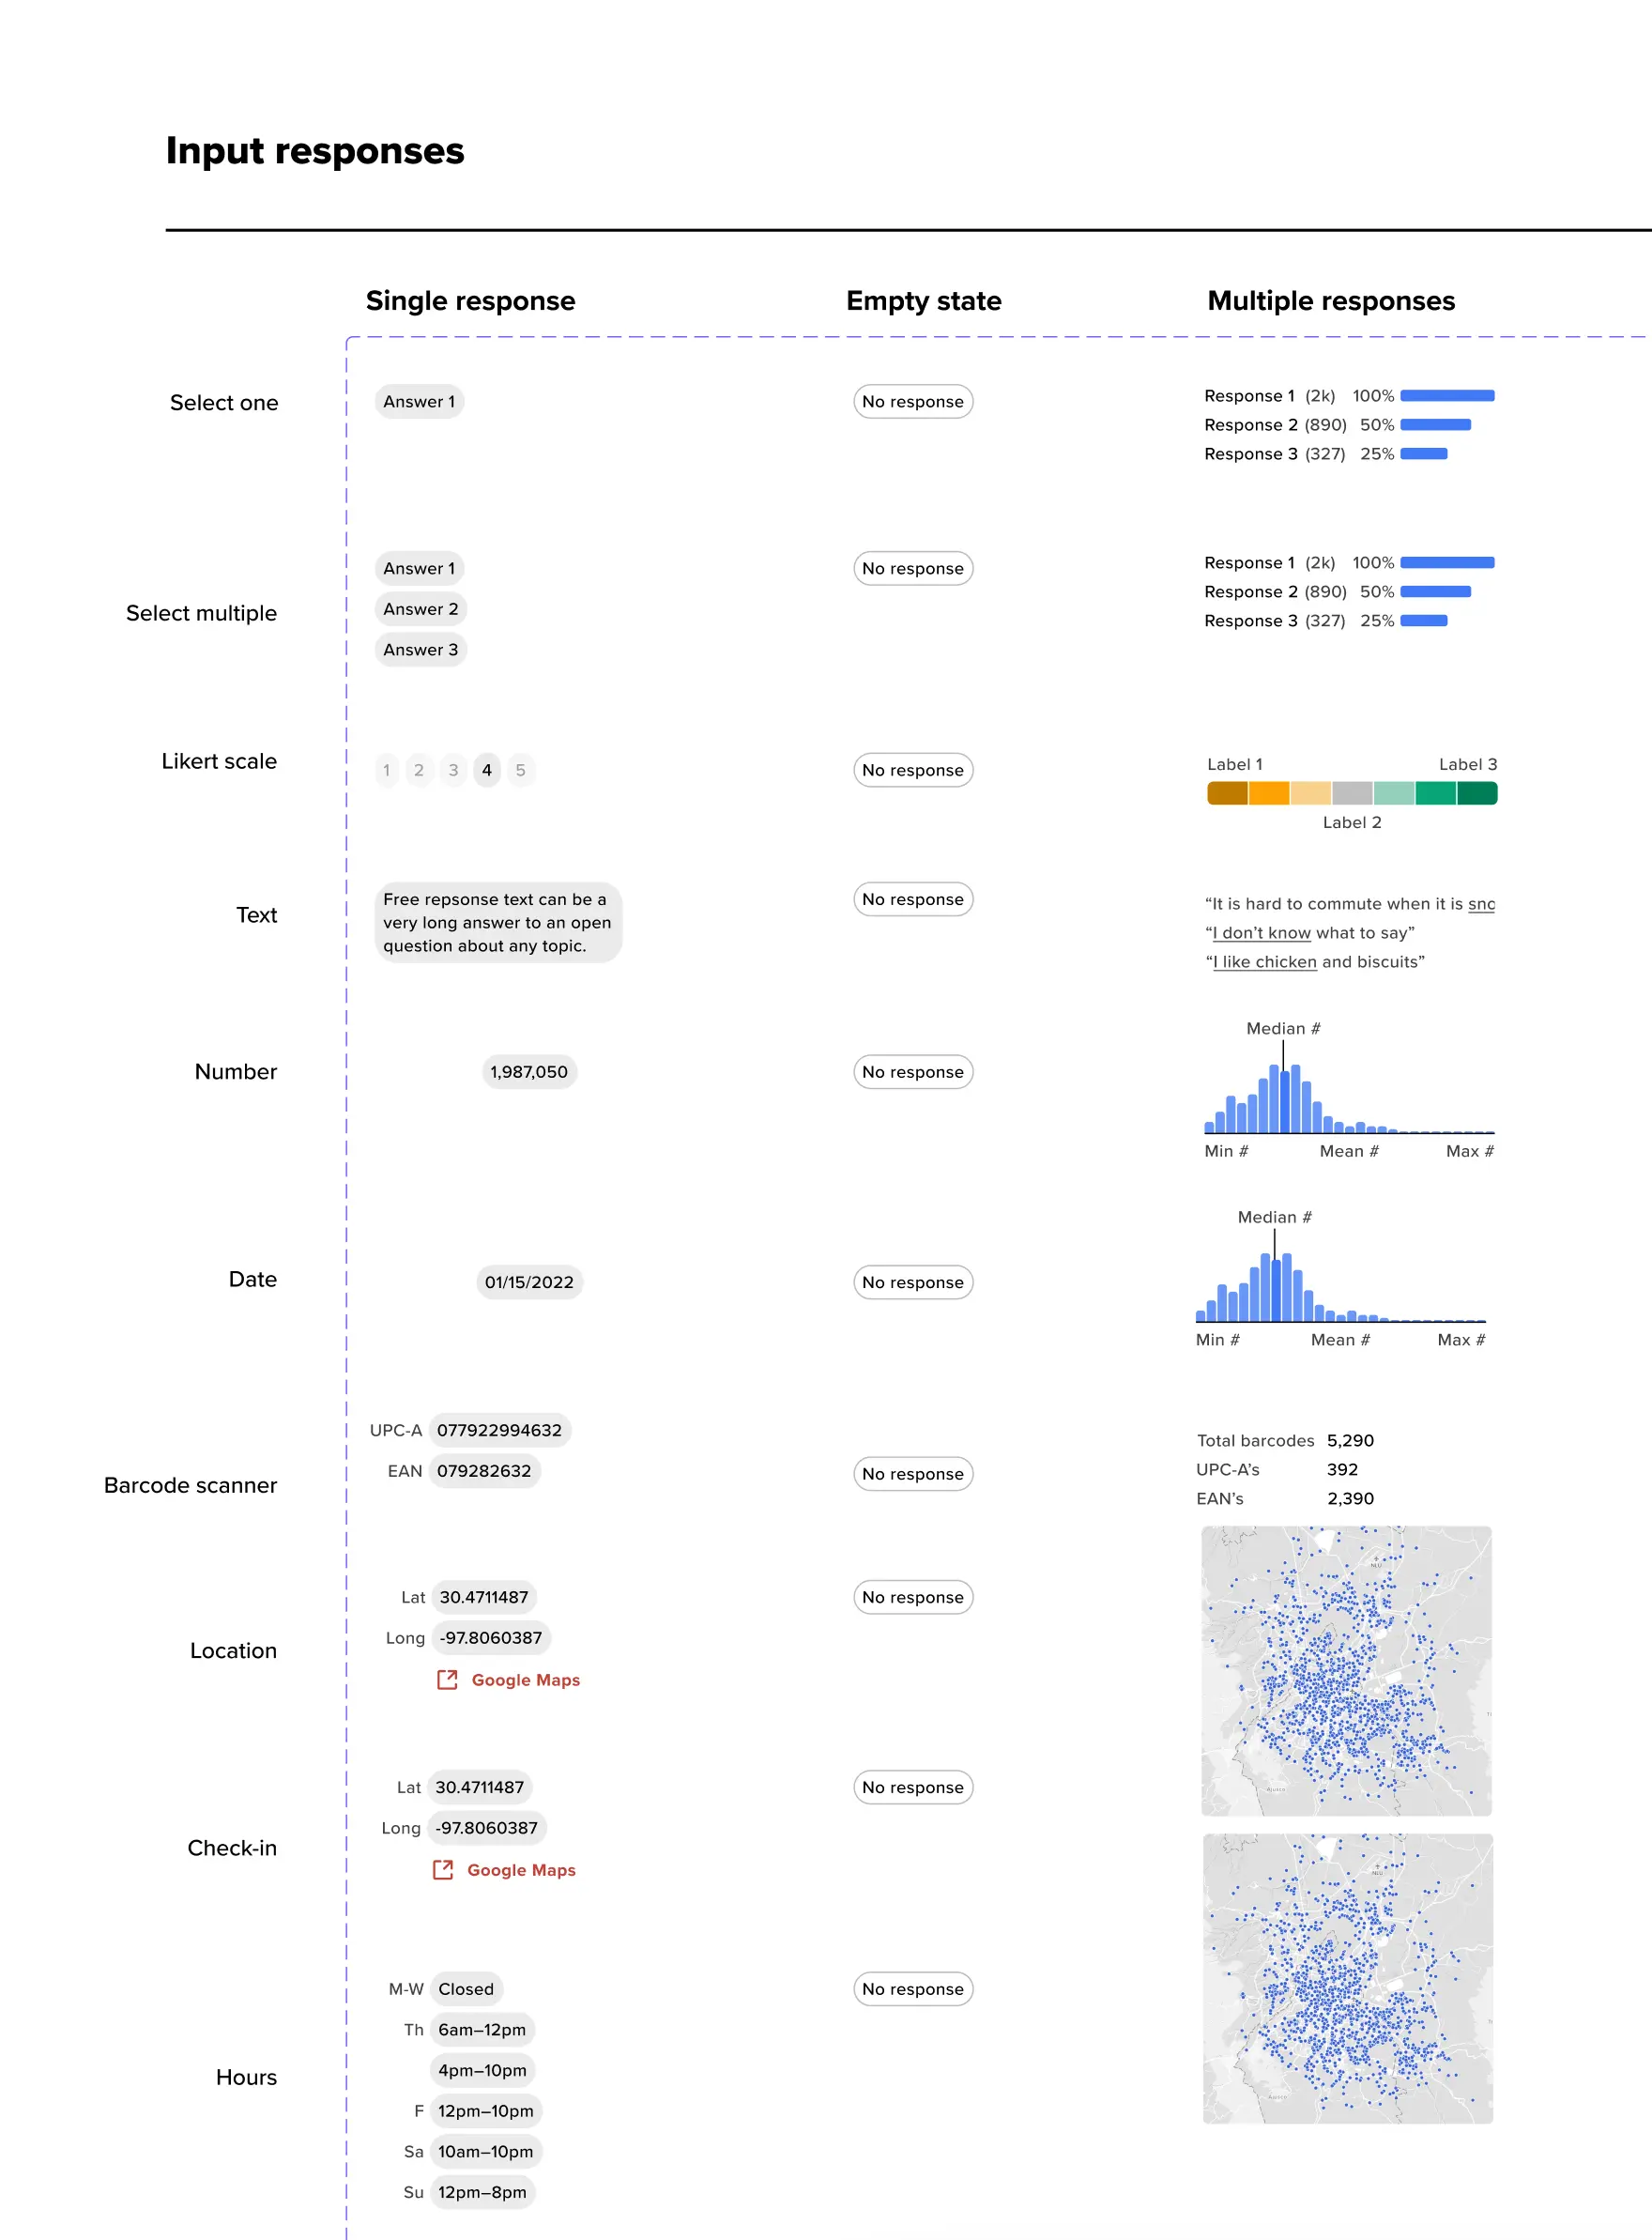
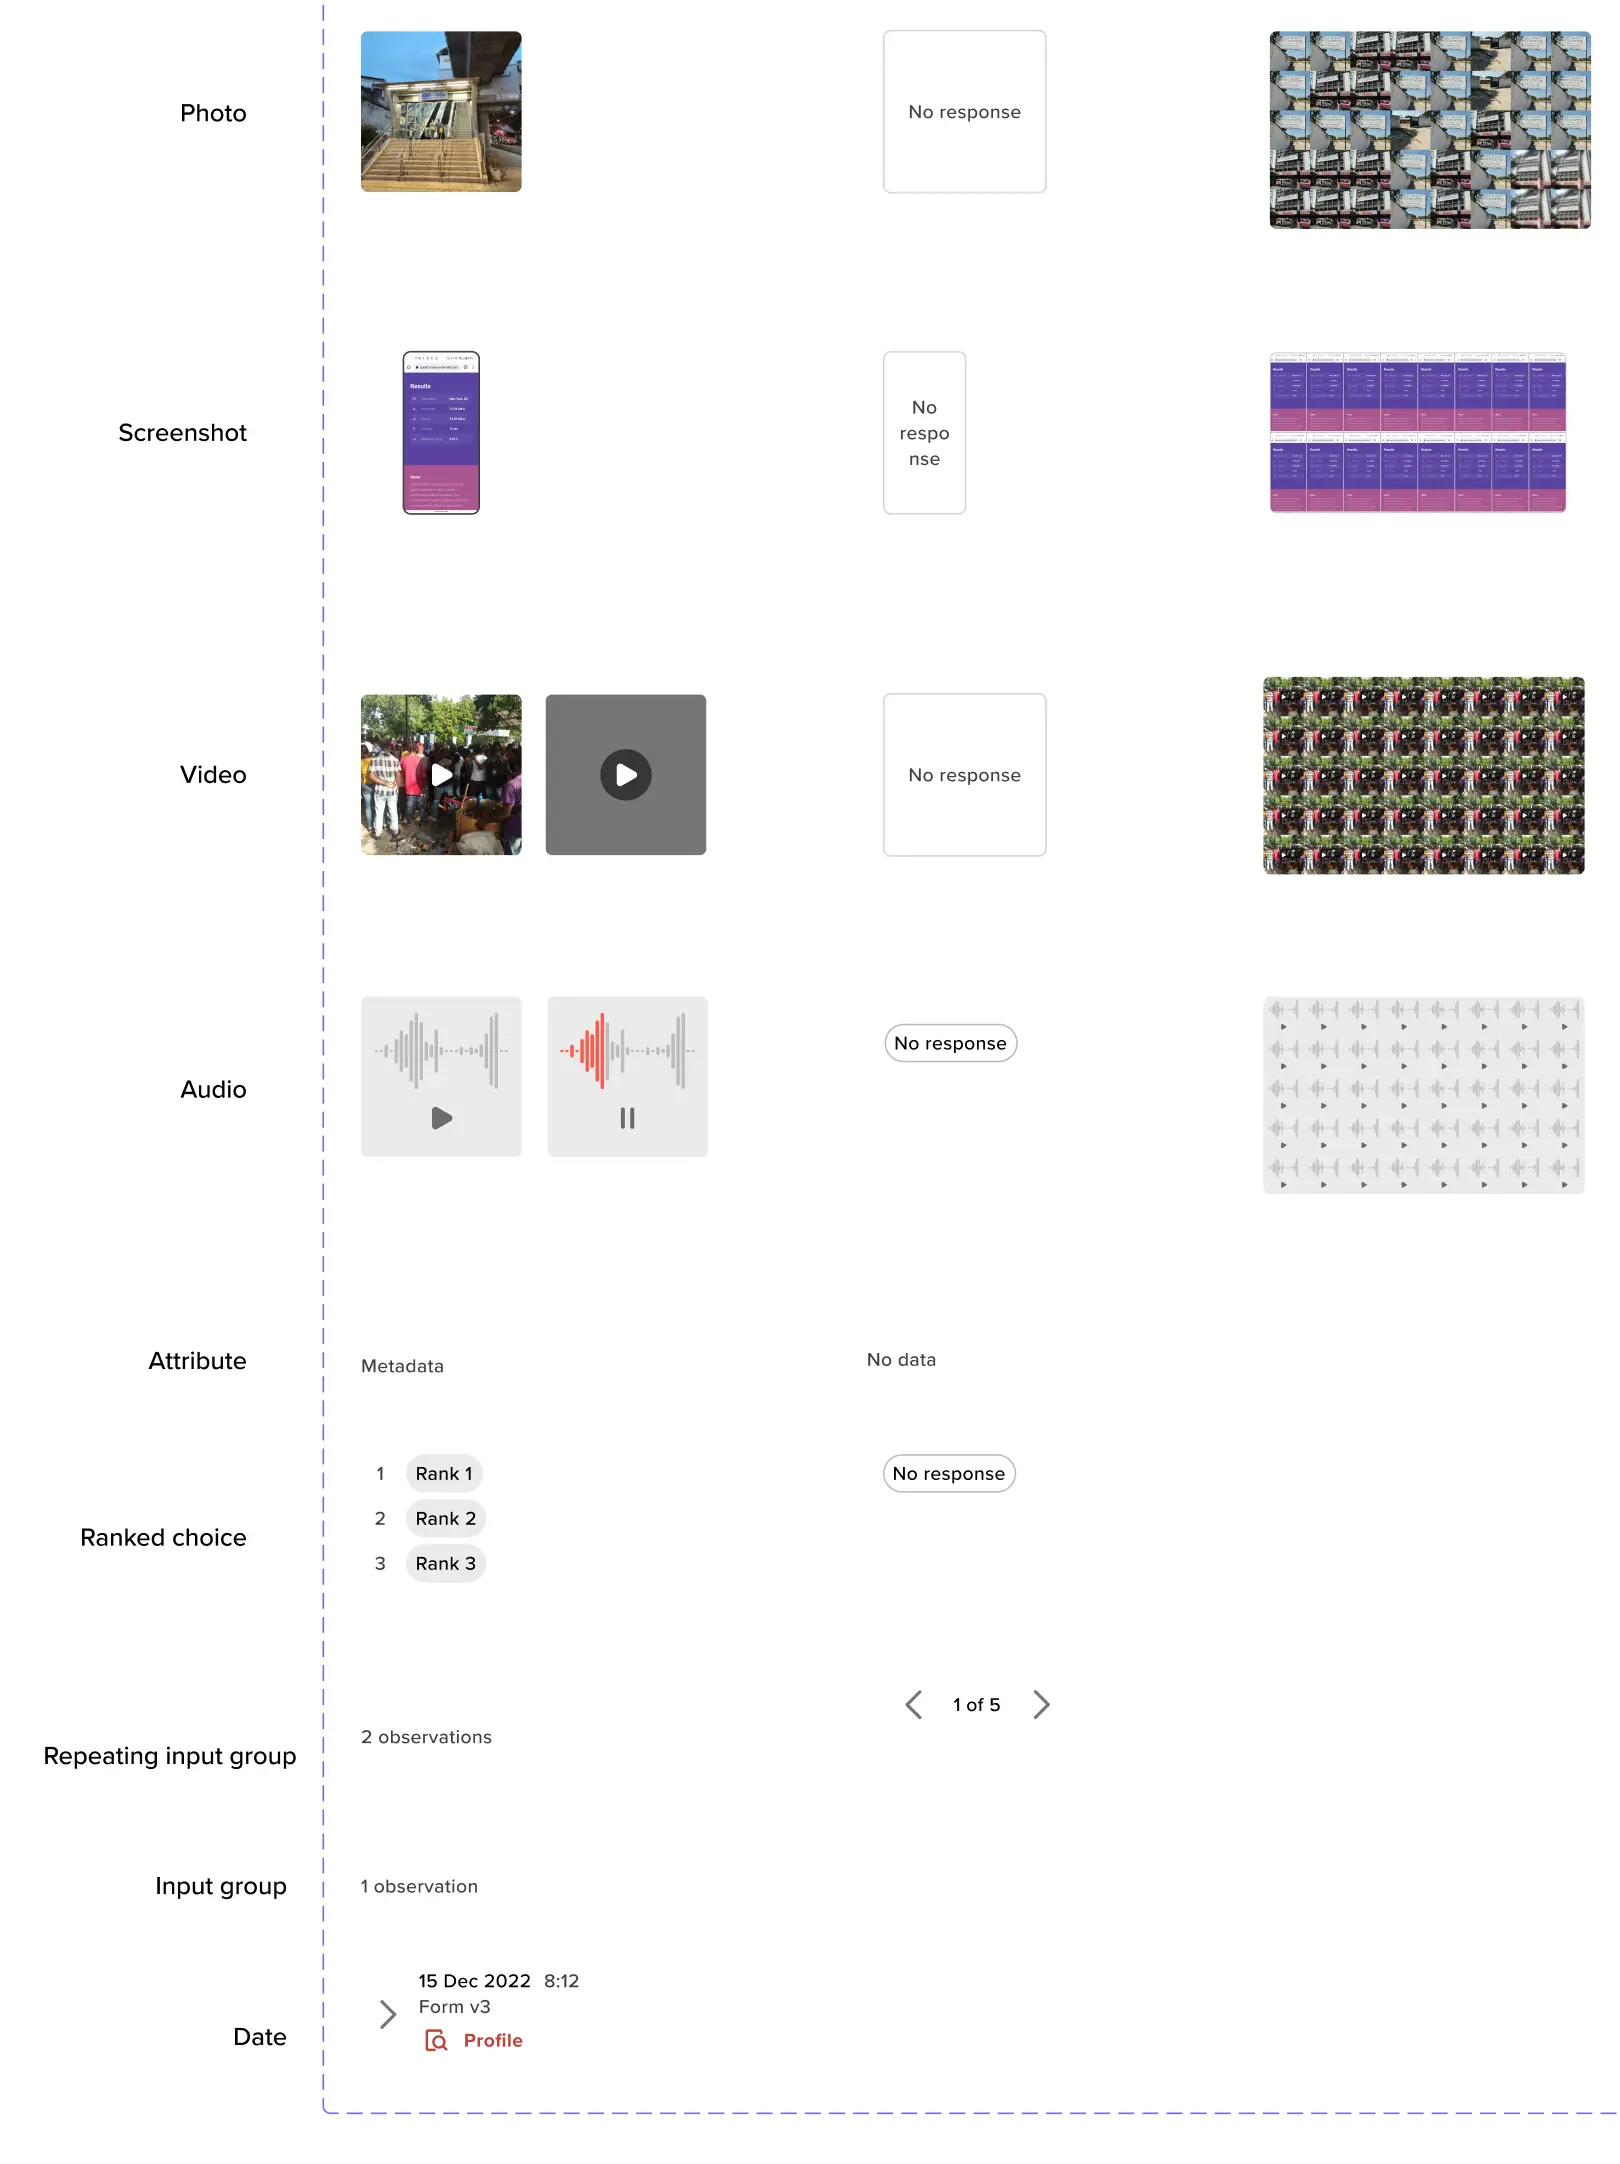
Templated visualizations
Applying systems thinking, each input type was paired with a visualization that could be integrated across different parts of the product. I also experimented with a variant to effectively summarize multiple responses.
The Impact
increase in customer engagement
Customers engaged with their results more frequently and for longer within the platform, reducing dependency on CSV exports.
Want to see more?
Get in touch with me to see my in-depth case studies.